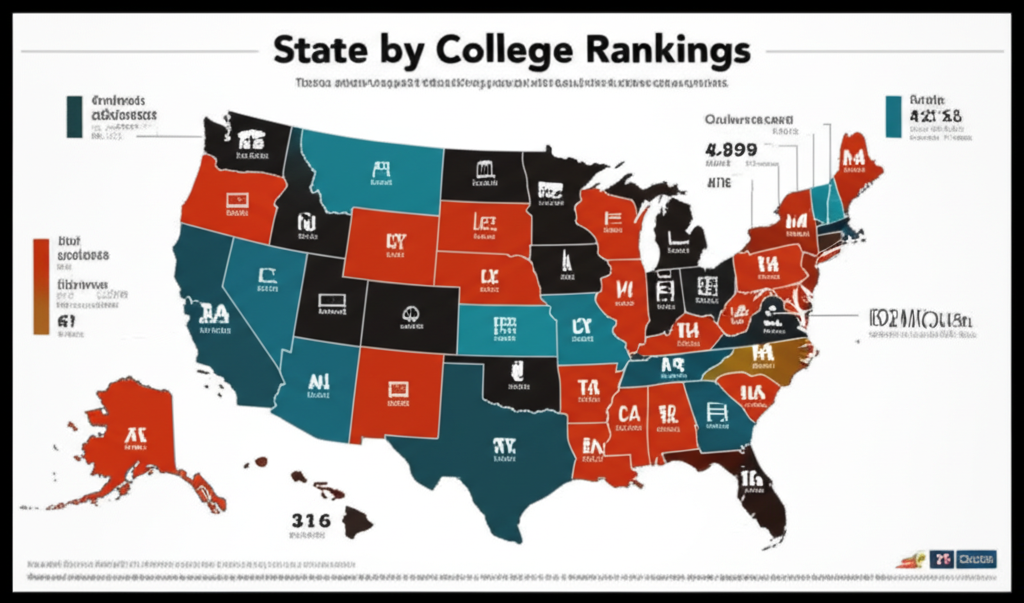
The Overall Rankings
Our comprehensive analysis evaluated all 50 states across five key metrics: affordability, graduation rates, post-graduation employment, student debt levels, and institutional quality. The results reveal significant regional patterns and surprising outliers.
Top 10 States for Higher Education (Overall Score)
| Rank | State | Overall Score | Affordability | Graduation Rate | Employment Rate |
|---|---|---|---|---|---|
| 1 | Massachusetts | 92.4 | B+ | 89.2% | 94.1% |
| 2 | Connecticut | 89.7 | B | 87.8% | 93.5% |
| 3 | New Hampshire | 88.9 | C+ | 91.3% | 95.2% |
| 4 | Vermont | 88.2 | C | 88.9% | 92.8% |
| 5 | New Jersey | 87.6 | B- | 86.4% | 93.7% |
| 6 | Maryland | 87.1 | B | 85.9% | 94.3% |
| 7 | Virginia | 86.8 | B+ | 84.7% | 92.9% |
| 8 | Washington | 86.3 | A- | 82.1% | 91.4% |
| 9 | Colorado | 85.9 | B | 81.8% | 90.7% |
| 10 | California | 85.4 | B- | 79.3% | 89.8% |
Scores based on weighted average of five key performance indicators
Regional Patterns
The Northeast dominates the top rankings, with 6 of the top 10 states located in New England and the Mid-Atlantic region.
The Bottom 10 States
At the other end of the spectrum, several states struggle with significant challenges in higher education access, affordability, and outcomes.
Bottom 10 States for Higher Education
| Rank | State | Overall Score | Primary Challenge | Graduation Rate |
|---|---|---|---|---|
| 41 | Alabama | 62.3 | Low graduation rates | 67.2% |
| 42 | Mississippi | 61.8 | Affordability & outcomes | 65.8% |
| 43 | Louisiana | 61.2 | Student debt levels | 66.4% |
| 44 | Arkansas | 60.9 | Employment outcomes | 64.1% |
| 45 | West Virginia | 60.1 | Population retention | 62.7% |
| 46 | Oklahoma | 59.8 | State funding cuts | 63.9% |
| 47 | Nevada | 58.9 | Institutional capacity | 61.2% |
| 48 | New Mexico | 57.4 | Multiple challenges | 59.8% |
| 49 | Alaska | 56.7 | Geographic isolation | 58.3% |
| 50 | Wyoming | 54.2 | Limited options | 57.1% |
States ranked 41-50 face significant higher education challenges
Affordability Analysis
College affordability varies dramatically by state, influenced by public funding levels, tuition policies, and cost of living factors.
Most Affordable States for College
- **Wyoming:** Average annual cost $16,842
- **North Dakota:** Average annual cost $17,923
- **Utah:** Average annual cost $18,456
- **Florida:** Average annual cost $19,234
- **Nevada:** Average annual cost $19,567
Least Affordable States for College
- **Vermont:** Average annual cost $42,156
- **New Hampshire:** Average annual cost $41,234
- **Pennsylvania:** Average annual cost $38,967
- **Rhode Island:** Average annual cost $37,845
- **Massachusetts:** Average annual cost $36,234
"The data shows a troubling inverse relationship between affordability and quality in many states. Students often face a choice between accessible education and excellent outcomes."
— Dr. Michael Torres, Higher Education Policy Institute
Graduation Rate Champions
Some states significantly outperform others in helping students complete their degrees within six years.
States with Highest Graduation Rates
| State | 6-Year Graduation Rate | 4-Year Rate | Improvement Since 2015 |
|---|---|---|---|
| New Hampshire | 91.3% | 78.2% | +8.4% |
| Massachusetts | 89.2% | 76.8% | +6.7% |
| Vermont | 88.9% | 75.1% | +7.2% |
| Connecticut | 87.8% | 74.3% | +5.9% |
| New Jersey | 86.4% | 72.6% | +8.1% |
Top-performing states in degree completion
Employment Outcomes
Post-graduation employment rates and salary levels vary significantly by state, often correlating with local economic conditions and industry presence.
Employment Success
States with strong tech and finance sectors typically show higher post-graduation employment rates and starting salaries for their college graduates.
Student Debt Burden
Average student debt levels at graduation vary widely by state, influenced by tuition costs, financial aid availability, and family income levels.
Student Debt by State (Class of 2023)
| Lowest Debt States | Average Debt | Highest Debt States | Average Debt |
|---|---|---|---|
| Utah | $19,928 | New Hampshire | $39,410 |
| Wyoming | $21,345 | Connecticut | $38,650 |
| Nevada | $22,156 | Pennsylvania | $37,230 |
| California | $22,785 | Rhode Island | $36,890 |
| Florida | $23,234 | Maine | $35,670 |
Average debt for graduates with student loans
Policy Implications
The wide variation in state performance suggests that policy choices significantly impact higher education outcomes.
Successful State Strategies
- **Sustained public funding:** States maintaining higher education investment show better outcomes
- **Need-based aid programs:** Robust state financial aid improves access and completion
- **Transfer agreements:** Seamless community college to university transfers boost graduation rates
- **Industry partnerships:** Strong university-employer connections improve job placement
- **Performance funding:** Tying funding to outcomes incentivizes institutional improvement
Looking Forward
States at the bottom of the rankings are implementing reforms to improve their higher education systems, while top performers work to maintain their advantages.
Reform Efforts
Several low-ranking states have launched major higher education initiatives, including Oklahoma's 'Reach Higher' program and Nevada's 'Millennium Scholarship' expansion.
